Archive for category machine learning
Genetic Algorithm Examples
Posted by Howard Yeend in machine learning on March 3, 2011
There’s been a lot of buzz recently on reddit and HN about genetic algorithms. Some impressive new demos have surfaced and I’d like to take this opportunity to review some of the cool things people have done with genetic algorithms, a fascinating subfield of evolutionary computing / machine learning (which is itself a part of the broader study of artificial intelligence (ah how academics love to classify things (and nest parentheses (especially computer scientists)))).
If you’re new to genetic algorithms, don’t be put off by the awesome/scary name – you might like to check out my own modest contribution to the field of abusing science to make cool useless things; the hello world genetic algorithm tutorial. It’s written as a short genetic algorithm tutorial to help beginners understand genetic algorithms from the ground up (and it has a pretty interactive demo in JavaScript too!).
So here’s my top five evolutionary scripts:
Read the rest of this entry »
Genetic Algorithm For Hello World
Posted by Howard Yeend in javascript, machine learning on December 13, 2010

This article works through the creation of a ‘toy’ genetic algorithm which starts with a few hundred random strings and evolves towards the phrase “Hello World!”. It’s a toy example because we know in advance what the optimum solution is – the phrase “Hello World!” – but it provides a nice simple introduction to evolutionary algorithms.
I have written this article primarily for developers who have a casual interest in machine learning. I don’t talk much about the implementation of the code itself because there’s not much of interest there – the beauty of genetic algorithms is their simplicity, so the code isn’t that interesting, other than in as much as it’s not usual to do such things in JavaScript. For ‘real’ applications of genetic algorithms, I’d suggest looking into existing established frameworks for your language.
Read the rest of this entry »
A quick overview of machine learning techniques
Posted by Howard Yeend in machine learning on November 27, 2010
 Machine learning is a fascinating discipline. Often inspired by natural processes, it can produce astounding results in a wide range of applications. Modern web search is underpinned by ML techniques such as clustering and statistical text processing. Computer games make use of evolutionary algorithms to produce better artificial enemies. Your camera probably has face detection in it for aiding auto-focus. Machine learning is key to making our technology better and our lives easier.
Today I’m going to give a very brief and incomplete overview of machine learning technologies and applications. There are three broad types of machine learning: Categorisation, Optimisation and Prediction.
XKCD Colour Survey – a 3D visualisation
Posted by Howard Yeend in javascript, machine learning on May 4, 2010
Randall Munroe (of XKCD) has been running a “name the colour” survey for the last few months and today released the data. The results are broken down by gender, and he makes some fascinating obvservations.
I’ve been working on a colour-related project on and off for about a year now, and part of that has involved creating visualisations of the RGB colour space – plotting red on the X axis, blue on Y, green on Z. So I thought it would be interesting to map XKCD’s 954 most common colour names in three dimensions – his charts are nice n’ all, but sexy javascript 3d is, well, sexier:
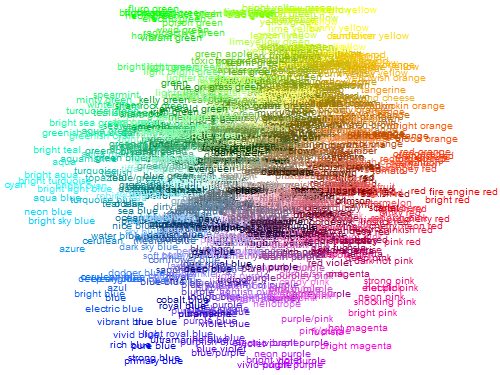
If you click that, you’ll be taken to the demo page, where you can interact with the cube. It’s a bit juddery, working entirely with divs and DOM manipulation, rather than canvas. Here’s a view from the side angle that shows off the “3d-ness” a bit more:

Of course, a canvas is really a better solution, so here’s a version that renders onto canvas, which is much much faster, but currently omits the names:
The K-Means Clustering Machine Learning Algorithm
Posted by Howard Yeend in machine learning on January 24, 2010
The k-means clustering algorithm is one of the simplest unsupervised machine learning algorithms, which can be used to automatically recognise groups of similar points in data without any human intervention or training.
The first step is to represent the data you want to group as points in an n-dimensional space, where n is the number of attributes the data have. For simplicity let’s assume we just want to group the ages of visitors to a website – a one-dimensional space. Let’s assume the set of ages is as follows:
{15,15,16,19,19,20,20,21,22,28,35,40,41,42,43,44,60,61,65}
Now there are a number of ways we could separate these points out; one obvious way that springs to mind is simply to iterate over the set and find the largest gap between adjacent ages. For some sets this can work quite nicely, but in our case it would give us quite unbalanced groups; 15-44 and 60-65, the latter containing just 3 points, and the former being far too broadly distributed.
Using k-means clustering we can obtain more tightly defined groups; consider the set {1,2,3,5,6,9} – using the simplistic greatest distance technique we gain two sets {1,2,3,5,6} and {9}, while the k-means algorithm produces a grouping of {1,2,3} and {5,6,9} – more cohesive clusters with less dispersion of points inside the groups – k-means tries to minimise the sum of squares within a cluster:

Notice how in the first set of clusters the outermost points of the first cluster are quite far away from the middle of the cluster, while in the second set, the points in both clusters are closer the center of their groups; making these clusters more well-defined, less sparsely populated.
Now let’s have a look at the algorithm and work through the example age data to see if we can get a tighter grouping than 15-44 and 60-65 using clustering:
-
You are currently browsing the archives for the machine learning category.
-
Save & Follow


-
Promote JS

Recent Comments